plot: 1D and 2D Plot widgets
This package provides a set of Qt widgets for plotting curves and images.
The plotting API is inherited from the PyMca plot API and is mostly compatible with it.
Those widgets supports interaction (e.g., zoom, pan, selections).
List of Qt widgets:
- PlotWidget: A widget displaying a single plot.
- PlotWindow: A PlotWidget with a configurable set of tools.
- Plot1D: A widget with tools for curves.
- Plot2D: A widget with tools for images.
- ImageView: A widget with tools for images and a side histogram.
- StackView: A widget with tools for a stack of images.
By default, those widget are using matplotlib. They can optionally use a faster OpenGL-based rendering (beta feature), which is enabled by setting the backend argument to 'gl' when creating the widgets (See Plot).
Note
This package depends on matplotlib. The OpenGL backend further depends on PyOpenGL and OpenGL >= 2.1.
For an introduction to the widgets of this package, see Getting started with plot widgets.
For examples of custom plot actions, see Adding custom plot actions.
Widgets gallery
The silx.gui.plot package provides the following plotting widgets:
| Widget | Description |
|---|---|
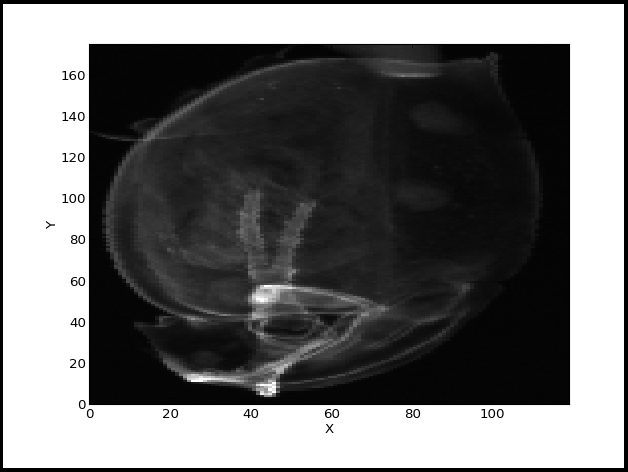 |
PlotWidget is the base Qt widget providing a plot area. Other plot widgets are based on this one and provides the same API. |
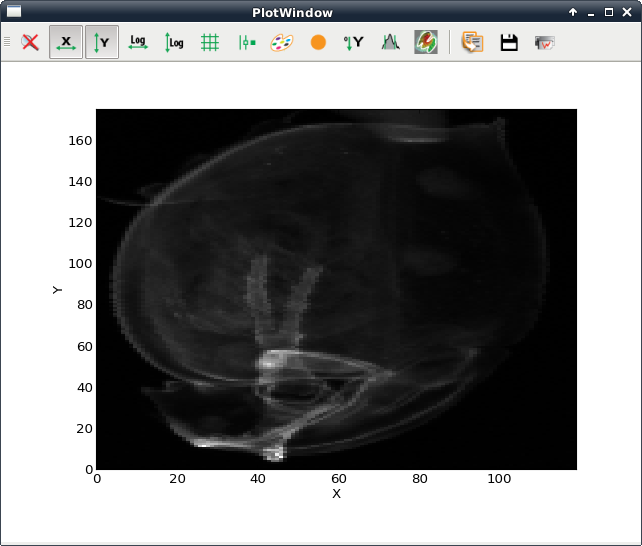 |
PlotWindow adds a toolbar to PlotWidget. The content of this toolbar can be configured from the PlotWindow constructor or by hiding its content afterward. |
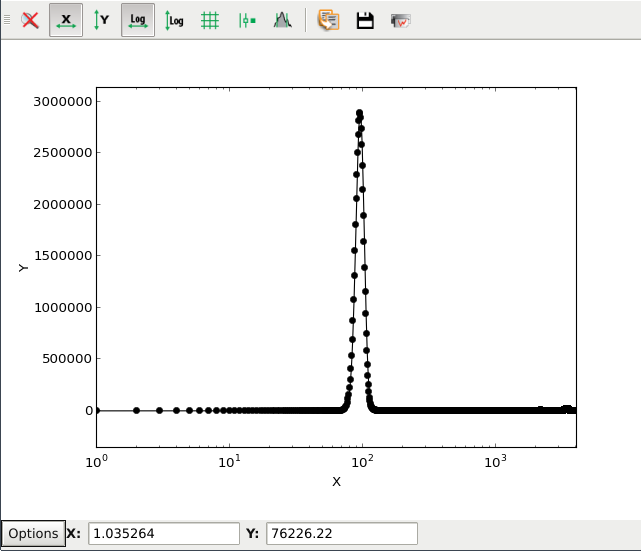 |
Plot1D is a PlotWindow configured with tools useful for curves. |
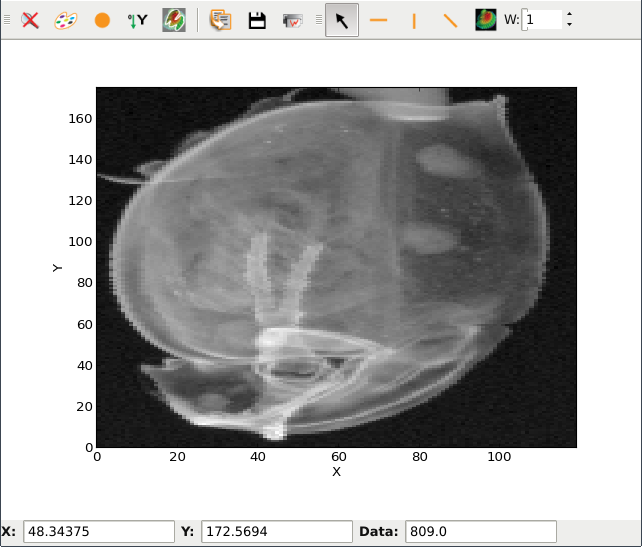 |
Plot2D is a PlotWindow configured with tools useful for images. |
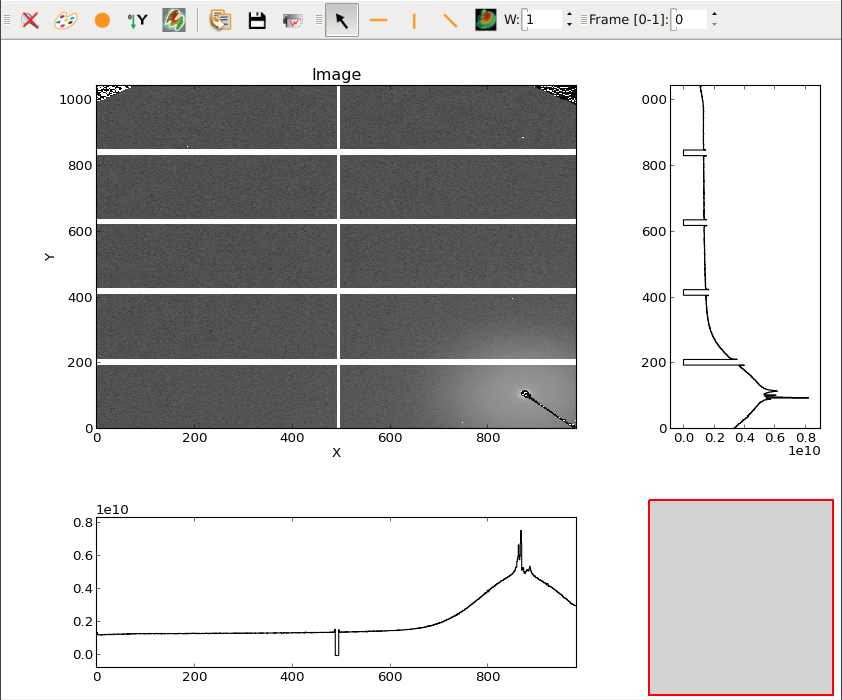 |
ImageView adds side histograms to a Plot2D widget. |
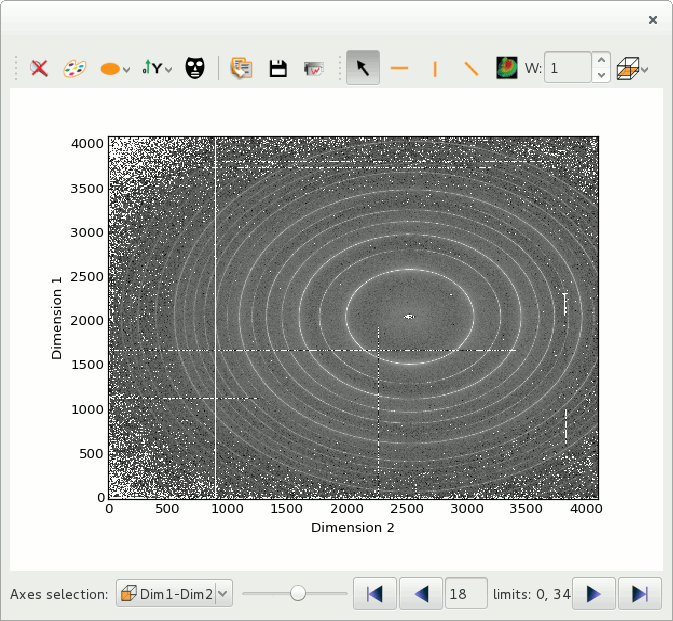 |
StackView is a widget designed to display an image from a stack of images in a PlotWindow widget, with a frame browser to navigate in the stack. The profile tool can do a 2D profile on the stack of images. |
It also provides (and uses) widgets that can be attached to a PlotWidget:
| Widget | Description |
|---|---|
 |
PlotTools.PositionInfo is a widget displaying mouse position and information of a PlotWidget associated to the mouse position. |
 |
PlotTools.LimitsToolBar is a QToolBar displaying and controlling the limits of a PlotWidget. |
 |
ColorBar.ColorBarWidget display colormap gradient and can be linked with a plot to display the colormap |
Public modules
- PlotWidget: Base class for plotting widgets
- PlotWindow: Plot widget with toolbar
- ImageView: Plot an image with side histograms
- StackView: Plot a stack of images
- Plot: Full plot API
- items: Plot primitives
- PlotActions: Actions for PlotWidget
- PlotTools: Tool widgets for PlotWidget
- ColorBar: ColorBar Widget
- Profile: Toolbars with profile tools
- CurvesROIWidget: ROI from curves
