CurvesROIWidget: ROI from curves#
Widget to handle regions of interest (ROI) on curves displayed in a
PlotWindow.
This widget is meant to work with PlotWindow.
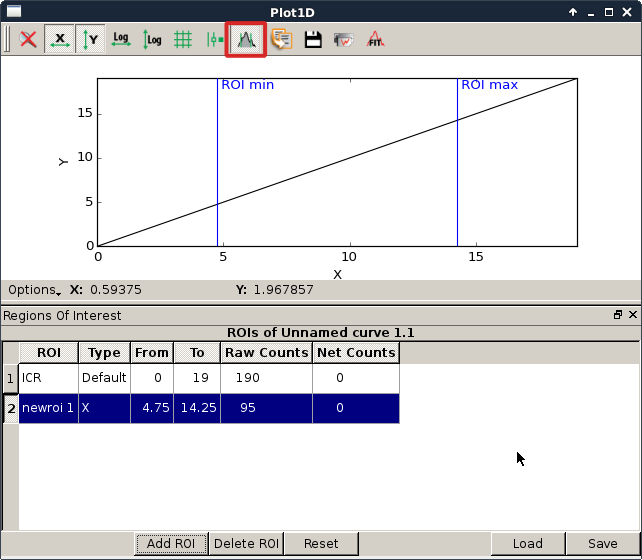
You can access to the ROIWidget from a Plot window by :
using the tool button ‘ROI’
using the options button then by selecting region of interest.
ROI class#
- class ROI(name, fromdata=None, todata=None, type_=None)[source]#
Bases:
_RegionOfInterestBaseThe Region Of Interest is defined by:
A name
A type. The type is the label of the x axis. This can be used to apply or not some ROI to a curve and do some post processing.
The x coordinate of the left limit (fromdata)
The x coordinate of the right limit (todata)
- Parameters:
str – name of the ROI
fromdata – left limit of the roi
todata – right limit of the roi
type – type of the ROI
- sigChanged#
Signal emitted when the ROI is edited
- computeRawAndNetCounts(curve)[source]#
Compute the Raw and net counts in the ROI for the given curve.
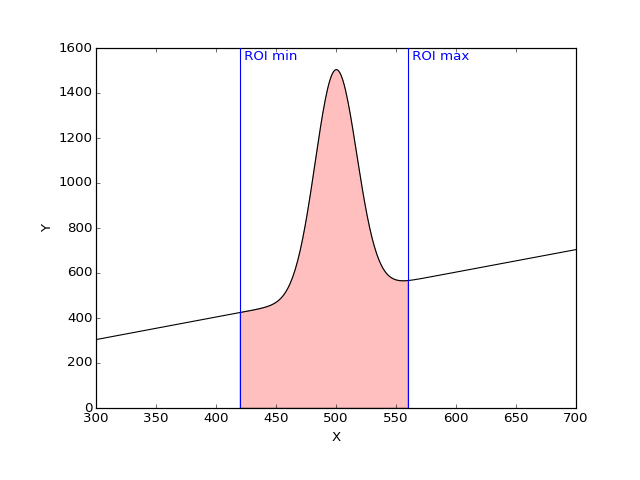
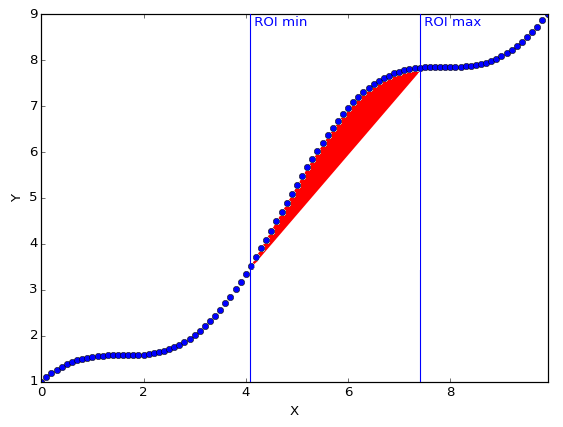
- Raw count: Points values sum of the curve in the defined Region Of
Interest.
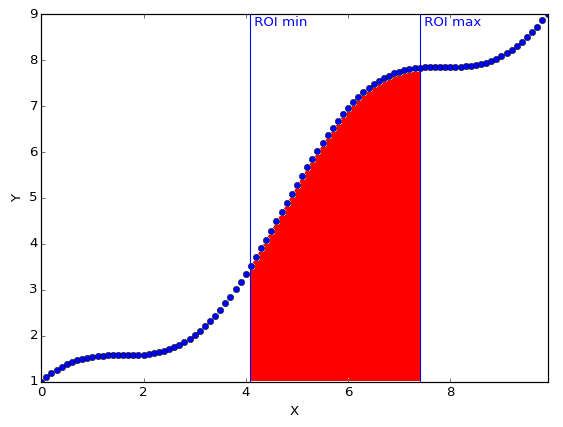
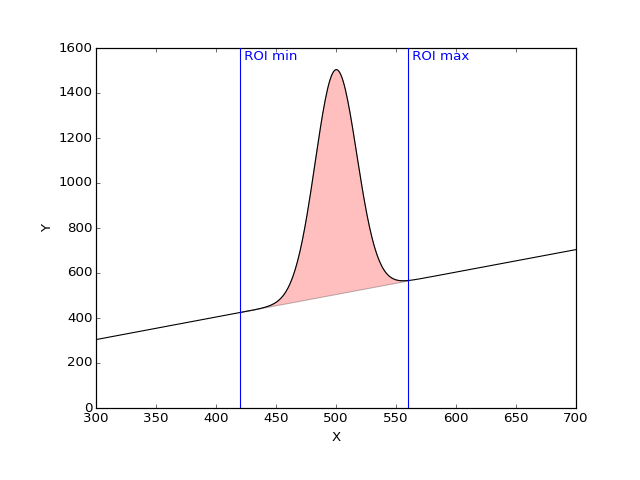
Net count: Raw counts minus background
- Parameters:
curve (CurveItem) –
- Return tuple:
rawCount, netCount
CurvesROIWidget class#
- class CurvesROIWidget(parent=None, name=None, plot=None)[source]#
Bases:
QWidgetWidget displaying a table of ROI information.
Implements also the following behavior:
if the roiTable has no ROI when showing create the default ICR one
- Parameters:
parent – See
QWidgetname (str) – The title of this widget
- sigROIWidgetSignal#
Signal of ROIs modifications.
Modification information if given as a dict with an ‘event’ key providing the type of events.
Type of events:
AddROI, DelROI, LoadROI and ResetROI with keys: ‘roilist’, ‘roidict’
selectionChanged with keys: ‘row’, ‘col’ ‘roi’, ‘key’, ‘colheader’, ‘rowheader’
- getPlotWidget()[source]#
Returns the associated PlotWidget or None
- Return type:
Union[PlotWidget,None]
- property roiFileDir#
The directory from which to load/save ROI from/to files.
- load(filename)[source]#
Load ROI widget information from a file storing a dict of ROI.
- Parameters:
filename (str) – The file from which to load ROI
ROITable class#
- class ROITable(parent=None, plot=None, rois=None)[source]#
Bases:
TableWidgetTable widget displaying ROI information.
See
QTableWidgetfor constructor arguments.Behavior: listen at the active curve changed only when the widget is visible. Otherwise won’t compute the row and net counts…
- activeROIChanged#
Signal emitted when the active roi changed or when the value of the active roi are changing
- setRois(rois, order=None)[source]#
Set the ROIs by providing a dictionary of ROI information.
The dictionary keys are the ROI names. Each value is a sub-dictionary of ROI info with the following fields:
"from": x coordinate of the left limit, as a float"to": x coordinate of the right limit, as a float"type": type of ROI, as a string (e.g “channels”, “energy”)
- Parameters:
roidict – Dictionary of ROIs
order (str) – Field used for ordering the ROIs. One of “from”, “to”, “type”. None (default) for no ordering, or same order as specified in parameter
roisif provided as a dict.
- removeROI(roi)[source]#
remove the requested roi
- Parameters:
name (str) – the name of the roi to remove from the table
- setActiveRoi(roi)[source]#
Define the given roi as the active one.
Warning
this roi should already be registred / added to the table
:param
ROIroi: the roi to defined as active
- getRois(order)[source]#
Return the currently defined ROIs, as an ordered dict.
The dictionary keys are the ROI names. Each value is a
ROIobject..- Parameters:
order – Field used for ordering the ROIs. One of “from”, “to”, “type”, “netcounts”, “rawcounts”. None (default) to get the same order as displayed in the widget.
- Returns:
Ordered dictionary of ROI information
- save(filename)[source]#
Save current ROIs of the widget as a dict of ROI to a file.
- Parameters:
filename (str) – The file to which to save the ROIs
- load(filename)[source]#
Load ROI widget information from a file storing a dict of ROI.
- Parameters:
filename (str) – The file from which to load ROI
- showAllMarkers(_show=True)[source]#
- Parameters:
_show (bool) – if true show all the markers of all the ROIs boundaries otherwise will only show the one of the active ROI.
- setMiddleROIMarkerFlag(flag=True)[source]#
Activate or deactivate middle marker.
This allows shifting both min and max limits at once, by dragging a marker located in the middle.
- Parameters:
flag (bool) – True to activate middle ROI marker
- setCountsVisible(visible)[source]#
Display the columns relative to areas or not
- Parameters:
visible (bool) – True if the columns ‘Raw Area’ and ‘Net Area’ should be visible.
- setAreaVisible(visible)[source]#
Display the columns relative to areas or not
- Parameters:
visible (bool) – True if the columns ‘Raw Area’ and ‘Net Area’ should be visible.
- fillFromROIDict(roilist=(), roidict=None, currentroi=None)[source]#
This function API is kept for compatibility. But setRois should be preferred.
Set the ROIs by providing a list of ROI names and a dictionary of ROI information for each ROI. The ROI names must match an existing dictionary key. The name list is used to provide an order for the ROIs. The dictionary’s values are sub-dictionaries containing 3 mandatory fields:
"from": x coordinate of the left limit, as a float"to": x coordinate of the right limit, as a float"type": type of ROI, as a string (e.g “channels”, “energy”)
- Parameters:
roilist (List) – List of ROI names (keys of roidict)
roidict (dict) – Dict of ROI information
currentroi – Name of the selected ROI or None (no selection)

