
silx view#
Purpose#
The silx view command is provided to open data files in a graphical user interface. It allows to select a particular piece of data or a particular header in structured data formats, and to view this data in plot widgets or in simple table views.
|
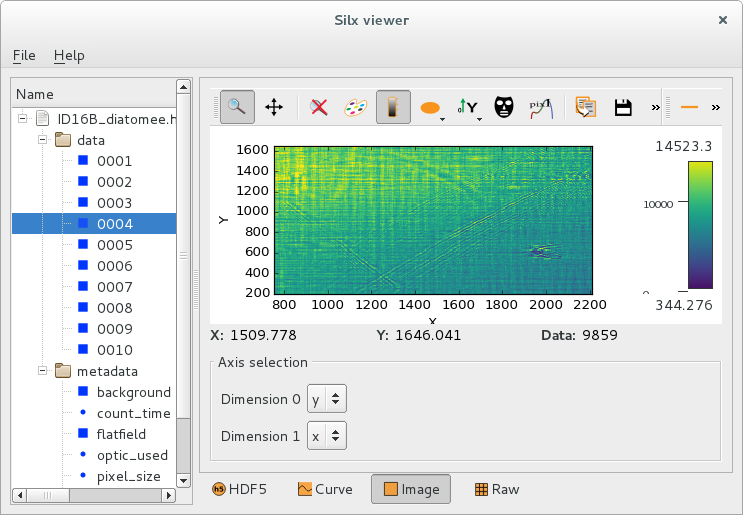
Image view |
|
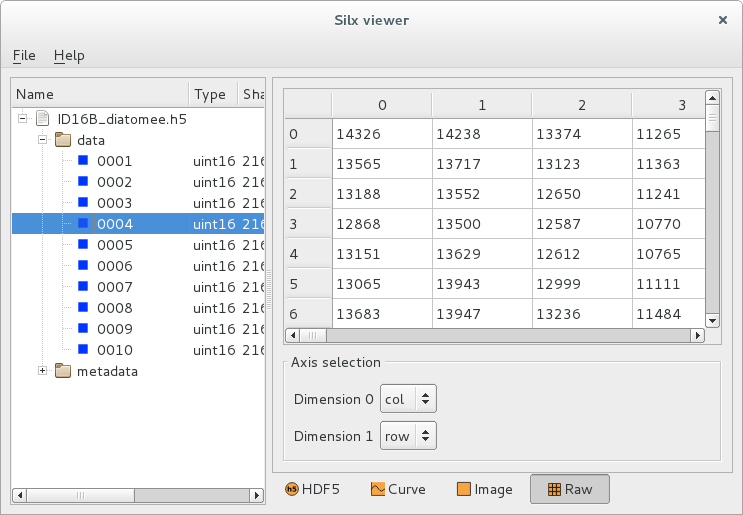
Viewing raw data as values in a table |
|
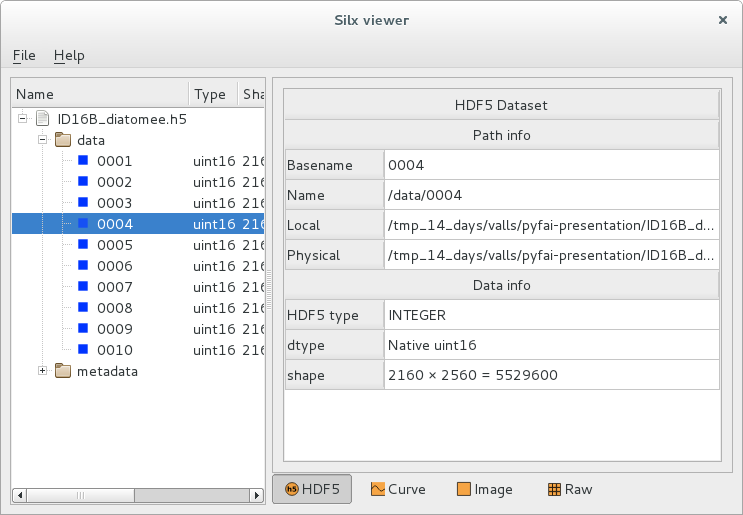
Viewing metadata and HDF5 attributes |
Custom plot selection#
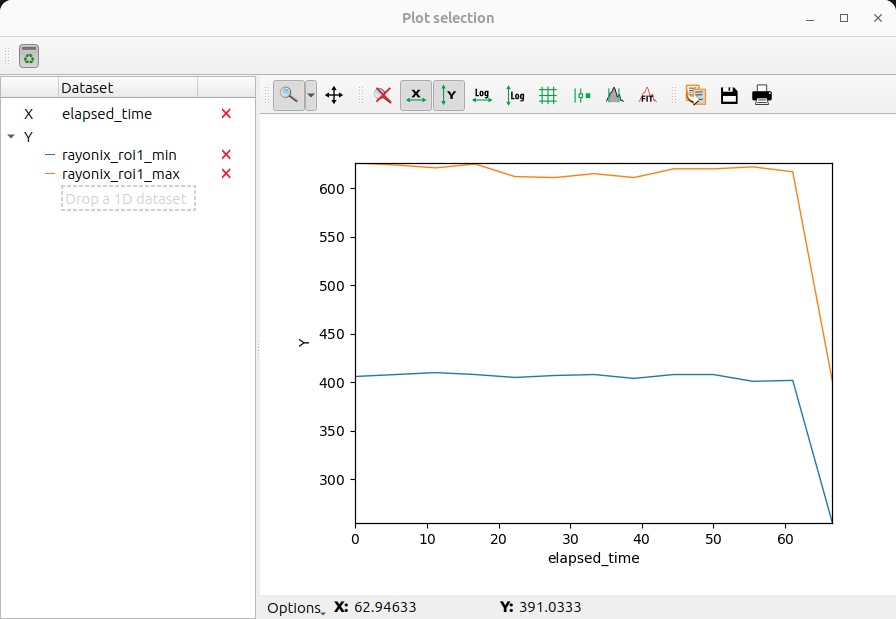
Plot custom curves from selected 1D datasets.
How to access#
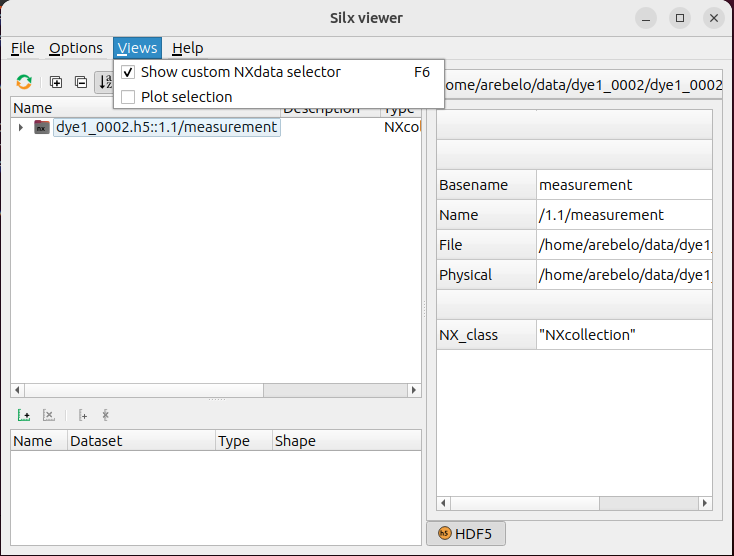
Open the ‘Plot selection’ window (View menu -> Plot selection)
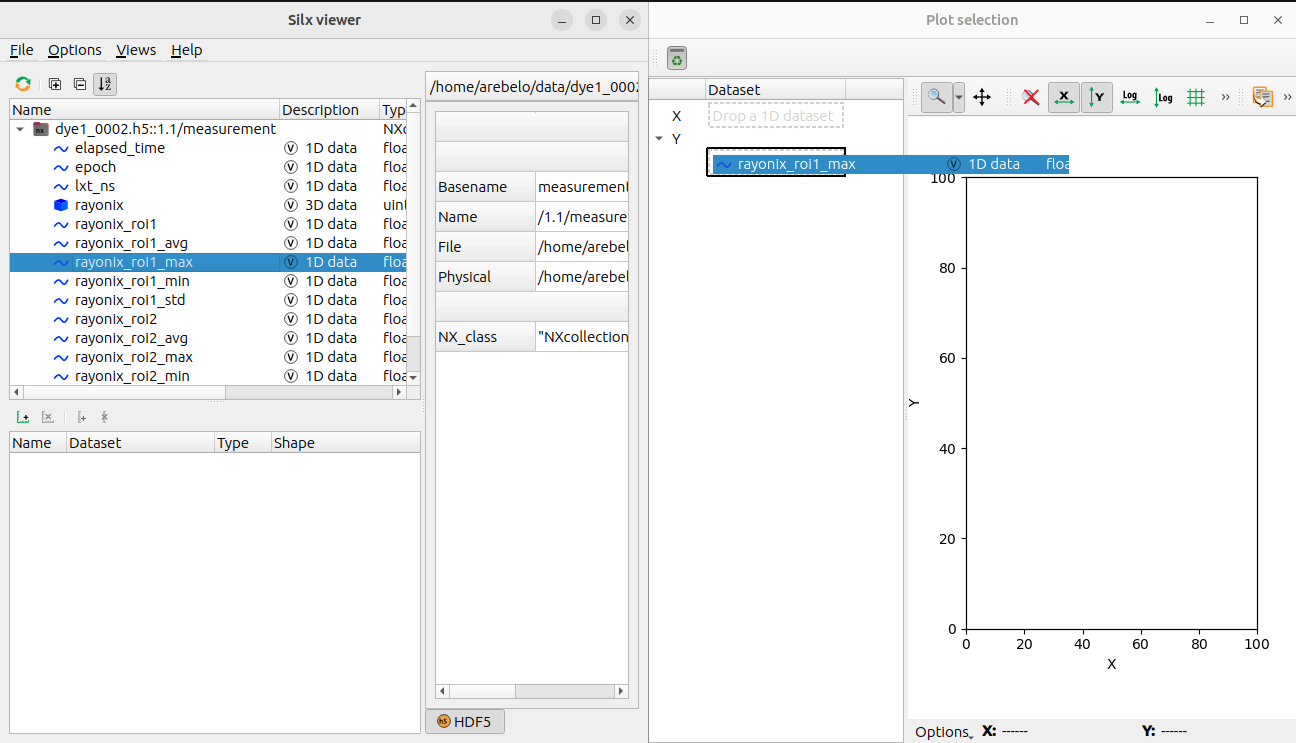
The “Plot selection” window opens: You can plot custom curves by dragging and dropping 1D datasets from “silx view” to “Plot selection” window’s “X” and “Y” fields.
Command line#
silx view [-h] [--slices SLICES [SLICES ...]] [--debug] [--use-opengl-plot] [-f] [--hdf5-file-locking] [files ...]
Options#
-h, --help            show this help message and exit
--slices SLICES [SLICES ...]
                      List of slice indices to open (Only for dataset)
--debug               Set logging system in debug mode
--use-opengl-plot     Use OpenGL for plots (instead of matplotlib)
-f, --fresh           Start the application using new fresh user preferences
--hdf5-file-locking   Start the application with HDF5 file locking enabled (it is disabled by
                      default)
Examples#
Open file(s)#
silx view 31oct98.dat
silx view *.edf
silx view myfile.h5
Open HDF5 dataset(s)#
Using the HDF5 path to the dataset:
silx view my_hdf5_file.h5::entry/instrument/detector/data
Using wildcard:
silx view my_hdf5_file.h5::entry/*/data
Open HDF5 dataset slices#
Open first and last slices of datasets:
silx view my_hdf5_file.h5::entry/*/data --slices 0 -1